Statistics
Track progress
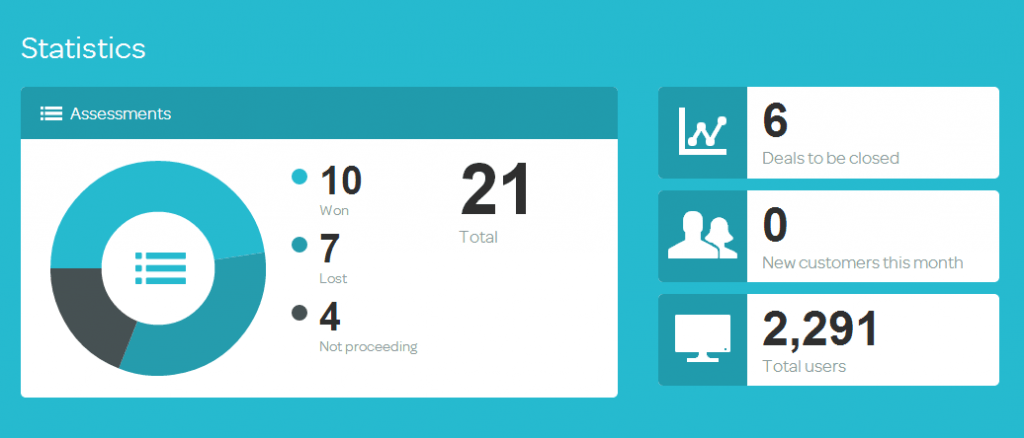
You’ll notice that front and centre on the Cloud Profiler dashboard are your statistics, which enable you to track your sales performance and gain insights into industries and customer types to target.
The headline statistic that is the most important is our ‘donut’ graph, which shows you a breakdown for all the assessments you have taken and set a final status against – ‘won’ ‘lost’ or ‘not proceeding’.
Although it would be great if you won every customer you assessed, it’s still important to update customers with ‘lost’ and ‘not proceeding’ as it will give you insights as to your most successful pitches, so you can get that lightest part of the doughnut as big as possible!
The other important statistics on the right hand side are:
• Deals to be closed – how many assessments you haven’t set a status against, to remind you to follow up on your leads
• New customers this month – shows you at a glance how many new customers you’ve added in the last 30 days
• Total users – the total number of seats that you have assessed over time
We’re always thinking about new ways to show the most important information to you. If you have any suggestions, please don’t hesitate to get in touch either by email or on Twitter.

